Thursday, September 30, 2010

Chart of the Day

Today's Chart of the Day is PAL. This stock was also part of the watchlist I had posted last night and the action in it today has forced me to go with this even for Chart of the Day today. The stock today managed to break free from the multi-week trading range, and it did so on impressive volume. The next serious resistance is at 4.42 though I expect there to be some resistance at 4.25 too. I had played this stock a lot in January but the dramatic drop from 5 levels made it drop from my radar screen. MACD also looks set to make a bullish cross tomorrow.


Here are my views on the market action today and strategy for tomorrow: Not bullish anymore.

Take care and good luck!

Short term neutral

Wow! What a day! You gotta love a day like today if you love trading! Good news on both the GDP and jobs front and the market goes up as expected. Financials finally show some signs of strength and the market shoots through the important resistance (1150). All's good and all's well, right? Wrong! The market shoots down for pretty much no reason and before long, we are down 80 points for no reason. Surely the bears have it now as we have gone down on good news. Wrong again! The bulls manage to take the S&P back into positive territory only for bears to take back the initiative in the last few minutes. Gotta love it!!

The regular readers of this blog know that I have been long and bullish on the markets ever since the market was testing the 1040 levels. But after the mixed signals today, I am not bullish anymore and am neutral on the markets (not the best way of saying it, but you know what I mean). That means, smaller positions and tighter stops than usual. And how long do I plan to stay neutral? Until the bulls convincingly take control of 1150 or bears of 1131. 

Personally speaking, I rounded off perhaps my best month of trading ever by selling SOLF at 13.27 for little over 8% gains, taking around half percent loss in AGCO (sold at 40). I also took  small positions in AKRX at 4.04 and APKT at 38. 

Hope all you readers had a great September too! There is a time to attack and a time to defend, and I believe right now is the time to play defense. 

Take care and good luck!

P.S.: Chart of the Day

Watchlist

Here are a few stocks I like heading into tomorrow. Remember, there is GDP data coming out in pre market tomorrow, so take the effect of that into account before taking positions in any of these stocks.

EC - A double bottom in place. The move today was on impressive volume. Watch out for new highs. MA(20) has provided good support throughout the uptrend.


MAPP - For a stock to close over 15 the very same day a stock offering is announced at 14.50 is very impressive indeed. Watch out for a break of 15.50.


PAL - Trying to break out of a multi-week consolidation range. Like this one here and took a position at 4.07 today.


In case you missed it, here are the links to Chart of the Day and my thoughts on the market action today.

Take care and good luck!

Wednesday, September 29, 2010

Chart of the Day

A word of caution about today's Chart of the Day. It has recently been a highly volatile stock recently, so if you do decide to play it, please stick to your stops. That out of the way, let's get down to today's stock - NEP. Below is the hourly chart since it resumed trading (apart from the very first hour). I really liked the action in this one today. It went up on impressive volume and consolidated nicely around the 5.75 mark. A break of 6 and this could really run.


Here are my views on the overall market. I also like GMXR here. Its a massively shorted stock and I had posted about it often on twitter today. It was up around 13% today but a break of MA(50), and it could run much more.

Take care and good luck!

P.S.: Here are some setups worth watching today.

A day of consolidation

If you are long, you really can't, or rather shouldn't, complain about today. The market can't just keep on going straight up and what we got today was some ol' fashioned consolidation. The market closed above the important support levels, so no damage done to the charts. For a while it seemed the market will finish green, but with GDP data out in the pre market tomorrow morning, the profit taking seen in the last one hour should come as no surprise. The important support and resistance levels are given in the posts linked below.


Personally speaking, I decided to continue with the profit taking strategy that I had adopted yesterday. I sold my BVN position, the gold miner, at 44.95 for a gain of 5%. NR was sold at 7.40 for 5.6% gain. The action in solar stocks in morning was unbelievable. As the regular readers of this blog know, I have been bullish on solar stocks pretty much this entire month. That said, the morning action in solar stocks was surprising even to me, not that I am complaining! I sold half of my SOLF position at 13.10 for a gain of around 7%. It was just one of those days, which sadly doesn't happen very often, when I felt really in tune with the markets. I also got into PAL at 4.07. 

I hope you readers have been collecting profits too! No matter how bullish one is on the markets, nobody ever got broke collecting profits. I would rather leave money on the table than see all my profits disappear. Been there, done that (on both) and the latter hurts more.

I will be back with the Chart of the Day and also a post on solar stocks.

Take care and good luck!

S&P Support levels

Following is a chart showing the S&P support levels to watch out for today - 1141 and 1131.


With regards to stocks, I like the action in SOLF today.

Good Luck!

Tuesday, September 28, 2010

Trading decisions and emotions

Since I have already posted my thoughts on the intraday reversal earlier today, I thought I would just do a detailed post on my trades today. I have gone in detail about the rationale behind my each and every move, some potentially right and some potentially wrong, today.

I took a position in BVN, a peruvian gold miner, at 42.80, which happens to be today's Chart of the Day. This buy was based on the momentum behind gold miners today in general, and the consolidation in this stock in particular. Since I have gone in detail about this particular stock in Chart of the Day post,  I wont repeat myself here.

The next trade I made was a position in NR at 7.95, a stock that was down over 7% today. Now, this is not the kind of trade I usually make. The regular readers of the blog know that I usually go with momentum plays. The logic behind this move can be seen from the intraday 5 minute chart below.


After a sharp drop at the beginning of the day, the stock consolidated for a long while around 7.95. Like I said this wasn't my typical play, but having traded this stock very often before, I felt quite comfortable going into it. But the most important thing in this trade was that due to the narrow consolidation range, I was able to keep a very close stop, so I wasn't really risking much. I like the way this closed, but this is meant to be a quick play and I will look to get out of this at the first opportunity tomorrow.

The next move I made was selling half my overnight AGCO position for less than half a percent loss. Why sell a stock in loss on a bullish day like today? Well, after the above two buys I was well into margin now, so I decided to reduce my exposure to the markets a bit and thus, I decided to cut off one of the laggards. One of the selling rules I try to adhere to is as follows. Whenever I know that my exposure to the market is such or there is a particular position that will keep me worried at the end of the trading day, I sell it. No charts, no analysis. You just cant put a price on peace of mind.

In the beginning of the post, I said I made some good decisions and some bad. Now let's come to my last trade of the day, one that I think I will regret. Close to the end of the trading day, I realized tomorrow was the last trading day of the month. This is one of the best trading months I have had (more on that tomorrow), and I suddenly felt this need to protect my profits. Even after the last sell, I was still on margin. I decided to sell my GSM position for 4.7% gain. As you can see the chart looks really good despite the negative MACD divergence, and I believe it still has some upside left. I am not too proud of this decision as I let my emotions get the better of me in this one.


I rather enjoyed doing this post as it was kinda therapeutic in nature. It turned out to be quite a decent day for me in the end. Next time, I will do a similar post when I have a frustrating day. You know, one of those day, when you can't help but feel that the market is out to get you. Hopefully, I won't be writing that post any time soon!!

Take care and good luck!

P.S.: As Chris rightly pointed out in the comments section below, tomorrow is not the last trading day of the month but the second last one. Just don't want any of you readers to get it wrong like I did!

Chart of the Day

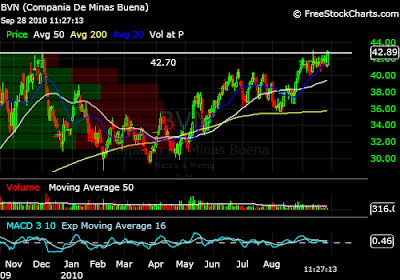
Today's Chart of the Day is a Peruvian gold miner, BVN. After weeks of consolidation around the MA(20), it finally broke the 42.70 level today, and it did so on decent volume. I had blogged about this stock this weekend and again today as it was just trying to break this level. I got in at 42.80. Hope some of you readers played this too! With the momentum that the gold bulls have, and the consolidation this stock went through, I expect this stock to have some legs here.


Here is the post on gold stocks from earlier in the day in case you missed it.

Take care and good luck.

Gold 1300

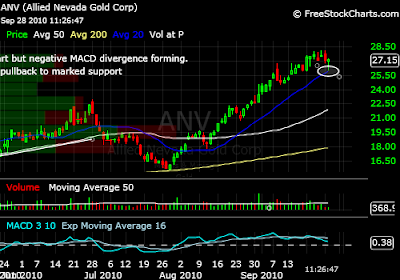
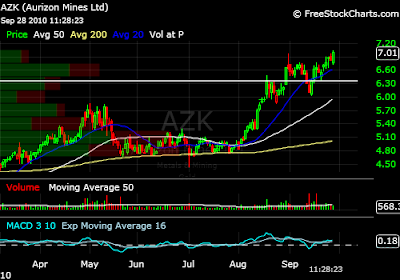
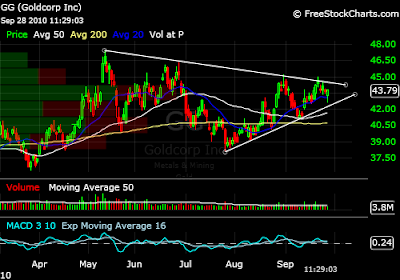
With gold making new highs today, here is a quick update on some gold stocks that I like here. As I had pointed out in a post over the weekend, MA(20) has provided constant support for the gold miners index in this entire run up and it was no surprise, to see the index again bounce from this level. Congrats to all those who caught this move up!


Below are also updated charts of some gold miners I like here, with important levels marked on them.


Here is a post on my views on the market action today so far.

Take care and good luck!

Bullish indeed

Its been an extremely bullish start to the trading day. Much more bullish in the long run that what even a gap up would have been. Whenever a market refuses to go down inspite of bad news, like the really bad confidence numbers that came out this morning, it is a really bullish sign. The other encouraging aspect of this day so far is that the market reversed off clear support levels.

S&P - Bounced off June highs. Did not break Friday's lows.


Nasdaq - Also bounced nicely off June highs.


Russell 2000 - Watch out for another attempt to break out of the multi month trading range.


Now, if only the financials would turn green too. Is that asking for too much??

Good Luck for rest of the trading day!


Monday, September 27, 2010

Stock market review

The daily index charts still look bullish but heading into the last hour of trading today, it seemed as if the bulls would be able to make the market close in the green today. But weakness in the financials (what else??) insured that the markets closed at their lows for the day. As far as the S&P is concerned, 1150 continues to act as tough resistance whereas support can be expected at 1132.

Russell 2000 paints an interesting picture. The small cap index got rejected right at the top of the trading range for the fourth time in last six trading sessions.


The financials continue to provide direction to the markets. The index closed right on top of MA(50). with MA(20) also providing support. Watch out for this level tomorrow for a sense of direction of where the overall markets are headed.


Personally speaking, I got into AGCO at 40.25 looking for a break of 40.70. It failed at this level and not wanting to be caught in a double top, I have moved my stop closer. Also added to my exisitng SOLF position at 12.30. I got out of DZZ at break even.

I will be back later with Chart of the Day.

Take care and good luck.

Sunday, September 26, 2010

Chart of the Day

The main criteria for today's chart of the day was that the stock should not be overextended. There are a lot of bullish setups out there that look great but most of them had a nice run up on Friday. Another criteria was though the stock should not have run up big (yet!), it should not have had a down day on Friday. A stock that can't go up when the market is up 200 points is, well...Now that you readers understand where I am coming from, let's get on with today's pick - BVF. The stock has undergone a decent period of consolidation since the last big move up. MA(20) has constantly acted as support since June and the stocked bounced nicely off the same moving average on relatively big volume on Friday. A stop below MA(20) should do the trick.


Take care and good luck!

Gold Stocks

With gold making all time highs, here are charts of few gold stocks I like here. The gold miners ETF looks good for a small pullback which should provide a good buying opportunity. For more details about that, click here. I have commented on the charts itself.


Here is a multi time frame analysis of S&P resistance levels.

Take care and good luck!

S&P resistances

Heading into next week, the momentum is clearly with the bulls. I thought it would be useful to find out where the next resistance levels lie, so decided to do a multi time frame analysis of the S&P charts. Hopefully, these charts will also go on to show the readers who are new to technical analysis the importance of taking multiple time frames into account while charting.

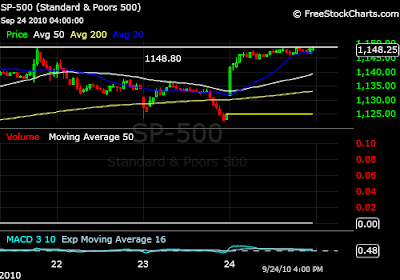
Let's start with the 15 minute chart of S&P. It is clear that 1148.80 is the immediate resistance level. The market was rejected right here first on the 21st and then thrice on Friday.


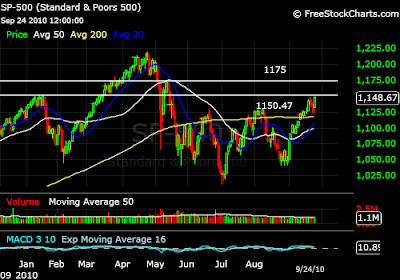
Moving on to the daily chart, 1150.47, where the market was rejected multiple times in January and 1175, where the index was rejected in May, are the important resistance levels.


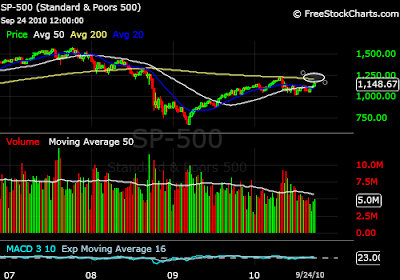
The weekly chart also turns out to be very interesting. The last run by the bulls met resistance right at the weekly MA(200). Watch out for the weekly MA(200) this time too!


Here is a watchlist of gold stocks that I like heading into next week.

Take care and good luck!

P.S:  Chart of the Day is now up.

Saturday, September 25, 2010

Gold Miners

With gold making new highs, I thought it would be interesting to have a look at how the gold miners are faring. So, here is a detailed analysis of the gold miners index. The gold miners ETF chart is very similar to the index chart shown below, so I won't be going through that. I decided to do a detailed study of the index as I thought it might be of some help to you charting newbies out there. Here is a daily chart of the gold miners index.


1. The first thing that should strike you is the importance of the 1508 level. This is the level where the index was thwarted at in November 2009 and it again acted as resistance thrice this year before it was finally broken through this month. I am sure you readers will agree that this is an important price level for the index.

2. The recent run in the index has found constant support at MA(20) during this rally from August. It has bounced off it four times during this run.

3. Notice the negative MACD and Stochastics divergence forming this month i.e. the price has gone up but the Stochastics and MACD haven't followed this price upwards but have instead gone down. This usually signifies a pullback in the near term.

4. To sum of all the above, a pullback to the 1508 level seems to be on the cards. At this level, the index should find support not only due to the important of this level, which was very important resistance earlier but has now become support but also due to MA(20), which should meet the price here.

In short, a successful test of this level should provide a great buying opportunity next week. I hope this detailed analysis was of some use to you readers. I will be back later with a shortlist of gold stocks that I like heading into next week.

Take care and good luck!

Friday, September 24, 2010

Bulls come back strongly

A short post today since its Friday afternoon. Let me start by saying that I didnt expect this great run by the bulls today. In hindsight, yesterday's move below 1130 now just seems like a fakeout. 1150 is the level to watch out on the S&P next week but more on that later this weekend. I didn't trade much today but still had a decent day thanks to my overnight GSM and SOLF positions. I sold half my GSM position for 13.79 for little over 3% gains, letting the rest run. I also entered DZZ, the double short Gold ETF at 9.70 with a tight stop, which didn't get hit.

Although I didn't trade much today, I am glad with the way I traded today. Actually, that's the very reason I am glad with the way I traded today. A year ago, I would have been anxious to make things happen on a day like today and frustrated on missing out on huge potential gains. But today, I just didn't feel like chasing any gap ups, so I just sat back and relaxed.  I know that a day or two hardly makes a difference to the larger picture. Maybe this is a sign of my growing maturity as a trader! I guess I will have to keep my fingers crossed on this one!

Make it a great weekend!

BAC, JPM, WFC, GS

With financials lagging behind and dragging the overall markets lower, I figured it makes sense to have a look at the main financial stocks to try and get an idea of where they were headed. I have a hard time believing that the markets can go much higher without the financial stocks. I have commented on the charts itself. All the charts are pointing in just one direction. See for yourself.


So, all the above stocks look bearish. Pretty much all of them struggled with MA(50) or/and MA(20) today. The charts do look a bit oversold and I think a move up to either of the above mentioned moving averages would provide a nice opportunity to short these stocks. The nearest support is still some distance away and a move to the bottom of their trading ranges, though some distance away, cannot be ruled out. That said, it is the earnings season and I would recommend knowing when these stocks are reporting before taking any position in them. 

In case you missed it, here are the links to Chart of the Day and my overall market analysis.

Take care and good luck!

Thursday, September 23, 2010

Chart of the Day

Today's Chart of the Day is GSM. Infact, this was presented in this section even last week when it was around 12.50 and as one can see, it has a made a big move up since. Congrats to all those who caught it! I like the way it is flagging here on low volume since the move up. One thing I would like to point out is that its a low volume stock, so if you do decide to play it, I would suggest scaling in rather than taking the entire position at once.


I also like JASO and NEP heading into tomorrow. In case you missed it, here is my review of today's market action and strategy for tomorrow.

Take care and good luck!

The easy money is gone

Yes dear readers, the easy money in this rally is gone. Why do I say that? Have a look for yourself. Below is the hourly chart of S&P.


As you can see, this is the first serious pullback the market has seen since this rally started around the 1140 level. The S&P gave up the important 1130 level today and the next support is 1116 - the MA(200). And it will come as no surprise to those of you who are regular readers of this blog, that the rally stalled due to the financials. Here is a chart of the financials ETF.


Both the MA(50) and MA(200) were lost today and the next support is at 13.80. 

Nasdaq looks a little better compared to S&P as it managed to hold on to the 2325 support. Russel 2000 though is another story, as it has unlike the overall markets, it was not able to break out of its trading range during the current rally. It stopped right at the MA(200) today.


Personally speaking, I got stopped out of LVS at 32.90 for little over half a percent gain. For most of the trading session, it seemed like I had a winner here but then it fell down with heavy volume. I day traded JASO from 8.60 to 8.85 for around 3% gains. My biggest position right now is cash.

So, where do we head from here? Like I said earlier, this is the first serious pullback we have had in this rally and I believe the easy money in this rally is gone, at least for now. Sure we can continue to go up from here, but after the action today, it will take a few days for the charts to "correct" themselves. I am willing to wait for the markets to resolve themselves in either directions and decide where it wants to go. So, my strategy here is to look for day trades or take smaller positions. I am pretty pleased with how I have traded this rally so far and its time to switch to defense now.

I leave you readers with 30 minute chart of LVS. It's a good example of how stocks usually take stairs on the way up and escalators on the way down! 


Take care and good luck!

P.S. Chart of the Day

Watchlist - Autoparts

With Auto Parts being one of the best performing industries today, I thought it might be useful to have a look at the stocks in this industry, and sure enough I found some charts that I like here. The important levels are marked on the charts.

SMP - Has consolidated nicely the last couple of days. Watch out for the break of the upper trendline. A stop below today's lows should do the trick.


TWI - Two consecutive doji days after a big move up. Watch out for a break of 13.11.


CVGI - This is the one I like best of the lot. Trying to break out of a multi month flag after a move from 4.50 to 13.50.


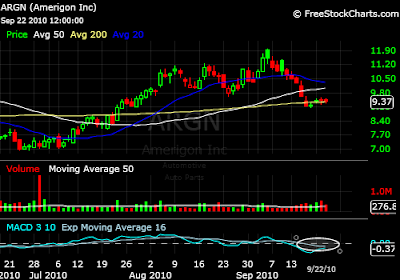
ARGN - Calling bottoms is not my trading style but for all of you who like to play them, this stock seems to have found support at MA(200) after a move down.


Check out my views on today's market action and today's Chart of the Day.

Take care and good luck!

Wednesday, September 22, 2010

Chart of the Day

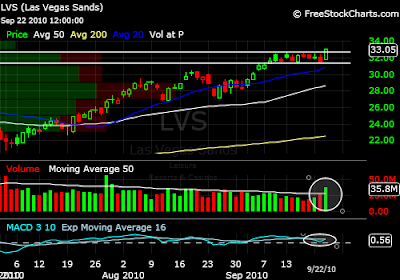
Today's Chart of the Day is LVS. After consolidating for almost two weeks, it finally broke out of its trading range today and it did so on impressive volume.  MACD is also on the verge of giving a bullish signal.


To really understand and appreciate the importance of this recent consolidation and move up, one has to look at the monthly chart. These are the levels the stocks found support in 2005 before a massive move up. The level acted as support also twice in 2008 before breaking down. I got in this today stock at 32.69 and it looks good to run from here.


Here are my thoughts on today's market action in case you missed it - A bullish day but.....

Take care and good luck!

A bullish day but.....

Though all the major indices closed down for the day, I still think today was bullish. Consolidation is but natural, and in fact, should be welcome if you are bullish after the run up we have had. And as I pointed out in the intraday post, the major support levels were well defended by the bulls. As I had posted the index charts in the earlier post, and the markets didn't change much since, I won't post these charts again. Here is the link to the earlier post.

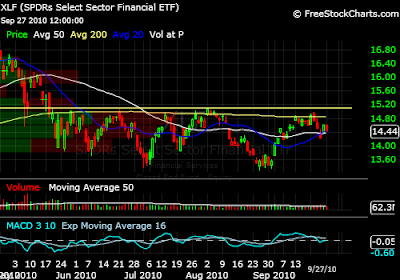
Let's focus on something else. Financials. As I have been saying for the past two days, I am of the opinions the markets will have a hard time continuing with its run up as long as the financials continue to lag. They continue to drag the markets down and today was no different. The financials ETF chart - XLF - doesn't look bullish by any stretch and MA(200) continues to be a tough nut to crack. For the market to move substantially higher from here, financials will have to move out of the multi-month trading range shown below.


Personally speaking, I got out of VXX at 17 for 3.15% gain. I got into GSM at 13.35 and LVS at 32.69. The latter was impressive today but I got in only after the breakout. This wasn't on my watchlist but I was alerted about the breakout by @TheArmoTrader on Twitter. I liked what I saw - the breakout was on good volume and the pulllback on low volume - so, I decided to step in. My strategy here is to look for quick profits and not get too greedy, at least not until the financials start performing.

I will be back later with Chart of the Day.

Take care and good luck!

Support levels

A down day so far but no damage done to the charts so far. As long as the important support levels for the bulls hold, I will continue to remain bullish. These levels are 1130 on S&P and 2325 on the Nasdaq and the bulls have done a good job of defending these levels so far. And of course, a positive close today would be really bullish and would just reinforce the importance of these levels.


Take care and good luck!

Tuesday, September 21, 2010

Markets NOT Overbought

With a lot of talk around of the markets being overbought, it's time to turn to our trusty ol' McClellan Oscillator for checking if the markets have actually reached overbought levels. Without further ado, below are the two year charts of NYSE and NASDAQ McClellan Oscillators respectively with the overbought levels marked on them.


As we can see from the above charts, the markets have not reached overbought levels, at least not yet. I admit I was one of those who expected the markets to have reached levels. Of course, this does not mean that we go straight up from here, but just that odds don't favor the bears quite yet. That said, watch out for financials which might drag on the overall markets.

Click here for Chart of the Day. Also, check this free special report on why diversification doesn't work if you haven't done so already.

Take care and good luck!