Friday, June 29, 2012

How to play gap ups?

With the futures indicating that the markets will gap up tomorrow, I thought this seemed like an appropriate time to discuss how to play gap ups. I had done a series of posts in 2010 on how to play gap ups, and they happen to be amongst the most read posts on the blog. If you find yourself often buying at the top and then just watching the stock down, or sitting on the sidelines as the stock continues to move up, these posts would hopefully be helpful to you.

How to play gap ups? -

You can follow me on twitter to get the latest blog updates.

Take care and good luck!

Thursday, June 28, 2012

Chart of the Day

Today's Chart of the Day is COST.  Like the general indices, it rallied quite nicely from its intraday lows today. In its case, it bounced from close to MA(20) and managed to close positive for the day, ending above a key resistance level in the process.


Today's price action completed over a week's consolidation period after a decent run up earlier this month. Also note the bullish volume pattern over this entire period of extension, consolidation and finally the breakout move today.

You can follow me on twitter to get the latest blog updates.

Take care and good luck!

Wednesday, June 27, 2012

Chart of the Day

Today's Chart of the Day is from the watchlist presented earlier this week. While some stocks from the watchlist have already made impressive move upwards, like CRIS and DAR, have already made impressive move upwards, some are still setting up. Amongst those stocks which are still setting up, one of my favorites is CVG. Have a look!


Been consolidating for weeks now and looks ripe to break out of its trading range. One might have to wait patiently for it to break out but when it finally does, it promises to be an explosive move going by the past history of the stock.

Take care and good luck!

Monday, June 25, 2012

Silver analysis

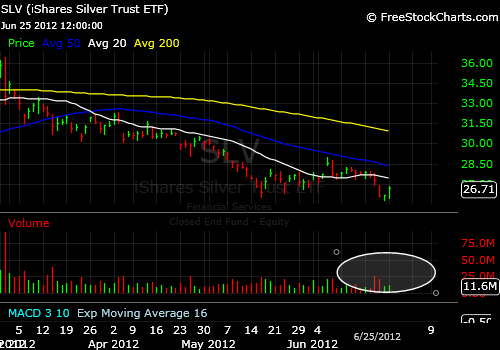
As you readers might be knowing, silver made a smart move upwards today. So, I thought it might be worth our time to have a look at silver.


25.60s was is the same level from where silver bottomed out even in May, making it the level to watch out for. The last move upwards was thwarted by MA(50), as was the case even in early April. The MA(50) now lies around the 28.50, so one can expect resistance there this time too. Though the move today was impressive, there was one thing missing. Any guesses?? Give yourself full marks if you answered volume. In fact, looking at the above chart, one can see that the volume pattern has been really bearish the last three months or so. Let's go back a little more in time to know about the importance of 25.60s, the level from where silver has bounced twice in the last two months.


 It turns out that this is the same level from where silver had bounced even in late December. Time for some more time travel.......


It is from this very level that silver had bounced even in January 2011, the beginning of what turned out to be a record run. Another fact which is very evident from the above chart is the downtrend that silver has been in since the middle of last year.

To sum it up, 25.60s is a very crucial support for silver. But remember, more and more a support keeps on getting tested, the weaker it keeps on going. Also, MA(50) would be the immediate resistance level to watch out for.

You can follow me on twitter to get the latest blog updates
Take care and good luck!

Sunday, June 24, 2012

Watchlist for next week


ACCO - Consolidating nicely over MA(50). A break of 10.65 and the next resistance is 11.40.


ARRS - Watch out for a break of 13.63.


CRIS -  Broke out of a consolidation pattern on Friday on good volume. Plenty of room up ahead.


CVG - Been consolidating nicely for the last two weeks or so. Pattern getting tighter with nice volume coming in on Friday. Watch out for close over 14.50.


DAR - Could see a quick move to 15.80.


MJN - Broke out on Friday on good volume. Like the consolidation before that, so it could extend the move in the next few days.

Overall, the markets did move up on Friday but that counts for little compared to the down move on Thursday. The bears seem to have the upper hand but we are still in a news dominated market.

You can follow me on twitter to get the latest blog updates

Take care and good luck!


Tuesday, June 19, 2012

Chart of the Day

A very bullish volume pattern....higher lows being formed.....and MA(20) acting as support in recent times. What's not to like? Have a look at SYNC yourself.


Take care and good luck!

Wednesday, June 13, 2012

A short watchlist

Following are charts of a few stocks that have been in confirmed downtrend but I feel still have room to go down further. The important support and resistance levels are marked on the charts itself. It might not be the smartest thing to short these stocks first thing tomorrow, but one should instead wait for a low volume bounce or break of important support levels. All said and done, they all look pretty bearish to me.


Take care and good luck!

Monday, June 11, 2012

Resistance ahead.....

It was a nice week for the bulls, with Friday also providing some nice action into the close. However, this is not the time to get greedy or go all in if you are bullish and it would be in fact not be a bad idea to start booking profits, if you haven't done so already (Please read note at the end of the post). Here's why.


Coming straight up next week is 1340 - an important resistance level about which I have written earlier too. A move straight to 1340 from here would mean the market would be in the overbought territory - not a good position to be in when you are about to tackle an important resistance. In my view, the best case scenario for the bulls here would be a consolidation period, giving them the much needed time to recharge their batteries to tackle 1340, which would probably itself be reinforced by MA(50) by that time. All said and done, don't let the price action last week fool you, the bulls face some tough time ahead.

Take care and good luck!

P.S.: This post was drafted before the news on Spain but I still decided to go ahead and post it as after this news, the sentiment and outlook might have turned more bullish than what was suggested in the post but the technical resistance levels mentioned still very much hold true.

Sunday, June 3, 2012

Not oversold

With the market falling hard in the last two trading sessions, it's time to turn to our trusty ol' McClellan Oscillator to check if the market has reached oversold levels just yet. While there is no single oscillator out there that can correctly time the markets, the regular readers of the blog know that we have had good results with McClellan Oscillator in the past. Below are the charts for the NYSE and NASDAQ McClellan Oscillator.


According the the above charts, the markets haven't reached oversold levels just yet but might get there with another day of heavy selling. In my opinion, the time is not yet ripe to go hunting for long positions, specially with the markets finishing below MA(200) on Friday. It might be best to just sit back, relax and let the markets decide its course instead of trying to be a hero.

Take care and good luck!