Wednesday, May 29, 2013

Chart of the Day

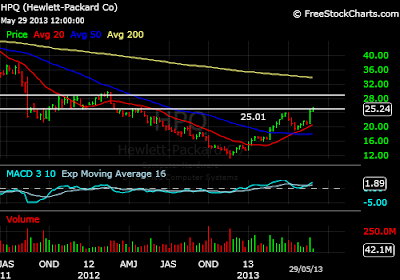
Today's Chart of the Day is HPQ. The over 2% up move was impressive on a day like today. This is what the story is so far. Gapped up big on earnings on Thursday, consolidated to test previous short term highs set in March on Friday and Tuesday, and broke the highs of the gap up today. All in all, a pretty decent chart.


The weekly chart makes things more interesting. The stock is right at the bottom of the trading range it had made for itself in October 20011 to March 2012. Nice support by MA(20) weekly which was acting as tough resistance earlier. If it does manage to break free of the current levels, the top of the previous trading range is 28+.


Seems right for a position trade.

You can follow me on twitter for latest blog updates. Also, here is the link for free subscription to the blog.   
 
Take care and good luck!

Sunday, May 26, 2013

Indian Stock market watchlist

Brittania. A name synonymous with biscuits in India. The biscuits might be quite good but more importantly, the chart also looks quite good over here. Following is the daily chart of Brittania Industries. Been consolidating in the 560-580 range for around a month now. The market has seen more than its share of ups and downs in this time period, but the stock has been quite steady.


Things get more interesting if you have a look at the weekly chart. 600 is clearly the level to watch out for. A break of this level, the all time highs, and the stock will have a clear run ahead.


Well, why point out this stock today? The stock reported better than expected earnings on Saturday and this news might just be the catalyst it needs to break out of its trading range and take a crack at 600. Watch out for it on Monday!

Update on Monday: Here is how the chart looks now. Up almost 16%. Hope some of you played it.


You can follow me on twitter for latest blog updates. Also, here is the link for free subscription to the blog.  
Take care and good luck!

Sunday, May 19, 2013

Watchlist for next week

Following are a few stocks that I like for next week. Are the markets extended? Yes. But what's new that? Can the markets correct at a moment's notice. Yes. But that's what the stops are for.

BYI - Gapped up big, consolidated on low volume, tested gap support, waited for MA(20) to come, bounced. End of story.


CSIQ - Solar stocks have seen some momentum in the last couple of weeks. Looks set for a breakout above 8.

SOHU - Has gone parabolic in the last couple of weeks or so. Would like to see some consolidation in this one. Wouldn't mind waiting for it to set up.


HIMX - Been consolidating the last couple of days after a breakout. Volume pattern for the last three months looks good.
 

MGA - Tested support successfully after gapping up. Watch out for new highs next week.


MXL - Tested support successfully on Friday. With volume coming in, could make a run for 7.20 next week.


TSO - Broke out on very heavy volume on Friday. The heavy volume suggests that there could be a lot more steam left in this move.


You can follow me on twitter for latest blog updates. Also, here is the link for free subscription to the blog.  
 
Take care and good luck!

Saturday, May 18, 2013

Indian Stock Market Watchlist

Following are a few stocks that I am going to be keeping an eye on next week. Actually, there are a lot more stocks on my watchlist, some of them even for long term, but the markets seem overstretched at the moment, so I am going to be waiting for a pullback or a period of consolidation before getting into those. The following stocks seem ripe for the taking though.

ONGC - An impressive run from 250 to 340, followed by a period of consolidation for 5 months and now its finally back to 340 again. Looks set for a breakout though I would prefer a day or two of consolidation first.


HDFC - At all time highs. Big moves followed by bullish flags seems to be the pattern here. Has been consolidating for the past two sessions on lower volume after a big move up. Watch out for a break of 910 with volume.


VIP Industries - Has seen some impressive volume on the upside in the last month. Should touch 75 on another one of those big volume days. Really like the volume pattern on this one!


Adani Power - Been consolidating for the last two months. Finally managed a close over 50 on Friday. Volume showing signs of coming back in. Looks set to break out of the consolidation pattern next week.


Feel free to mail me at positiontrader @ ymail.com (no gaps) if you have any questions on the Indian stock market. You can follow me on twitter for latest blog updates. Also, here is the link for free subscription to the blog.  
 
Take care and good luck!

Wednesday, May 15, 2013

Indian market at important levels

I was forced to come back from my blog hibernation due to the action in the Indian markets, or to be more specific, due to the chart shown below which I just had to share. Following is a 10 year chart of the Indian stock market. Quite a beauty, isn't it? The index has increased by about 7 times in the last 10 years. Made highs of ~6320 in 2007, after which it retraced 66%!! Retested the highs in 2010 only to head lower again. Well, it looks like it is going to be testing those highs again in the near future.


Its been four odd years since I got interested in trading and that means, four odd years of using Technical Analysis. But charts like the above, exhibiting a perfect ascending triangle, still continue to amaze me. Gotta love TA! Respect.

You can follow me on twitter for latest blog updates. Also, here is the link for free subscription to the blog.  
Take care and good luck!