Brittania. A name synonymous with biscuits in India. The biscuits might be quite good but more importantly, the chart also looks quite good over here. Following is the daily chart of Brittania Industries. Been consolidating in the 560-580 range for around a month now. The market has seen more than its share of ups and downs in this time period, but the stock has been quite steady.

Things get more interesting if you have a look at the weekly chart. 600 is clearly the level to watch out for. A break of this level, the all time highs, and the stock will have a clear run ahead.
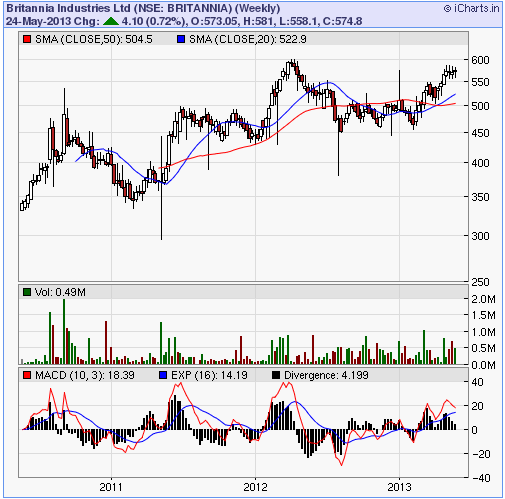
Well, why point out this stock today? The stock reported better than expected earnings on Saturday and this news might just be the catalyst it needs to break out of its trading range and take a crack at 600. Watch out for it on Monday!
Update on Monday: Here is how the chart looks now. Up almost 16%. Hope some of you played it.

You can follow me on twitter for latest blog updates. Also, here is the link for free subscription to the blog.
No comments:
Post a Comment