Sunday, October 31, 2010

S&P important levels

With all the news that is coming out this week, it very well might turn out to be a week where all the charts and technicals get ignored. But still, it is important to know what are the support and resistance levels to look out for in the indices as a break of these levels might have a long term effect on the technicals.

Support - MA(20) - currently at 1172.85. As I already wrote a complete post detailing the importance of this level, I won't go into it again. Here is the link for that post in case you missed it.


Resistance - (1) MA(200) on the weekly - currently at 1194.22. Weekly MA(200) is where the rally got stopped the last time. (2) YTD highs - 1219.8


It promises to be a wild week. In the spirit of being prepared for any eventuality, here are a few short setups that I like. No matter what you do, please remember to honor your stops this week. Not that there is any excuse to disregard them any week!

Take care and good luck!

Short candidates

The regular readers of this blog know that I haven't gone for short for a long time. In fact, I can't remember the last time I was short this market. My bias is still towards being long these markets but that being said, I am well aware of the possibility that a bad QE2 number on Wednesday and this market could fall....and fall fast. In the spirit of being prepared for any eventuality, here are a few short candidates I like here with comments on the charts itself.


I will be back later today with a post on the levels to look out for on S&P. Until then, here is SPY analysis and a post explaining why I am fully in cash right now.

Take care and good luck!

SPY Analysis

Monthly chart. Comments on chart itself.

Friday, October 29, 2010

S&P ends month at critical level

I normally don't look at monthly charts as the weekly charts cover sufficient time span, but I decided to look at the monthly S&P chart right now to see how the market fared in October. Well, I am glad I did so as it turns out the index finished the month at a rather level. S&P closed right below the monthly MA(50). Where did the April rally meet its end? Right at the monthly MA(50)! Its also interesting to note that MA(20) has provided support throughout this rally. Guess it won't hurt to look at the monthly charts a bit more often from now on!


Here is my strategy for the week ahead which should be quite exciting due to the elections and QE2 announcement.

Take care and good luck!

Strategy for next week

I know its a little early to be discussing strategy for next week but since I am going to be implementing it today itself, I thought I would share it with you readers early too. Getting right to it, here is what I intend to do:

(1) Move fully to cash before the close today.
(2) Stick to day trades until the FED QE2 announcement is out i.e. November 3.

The reasoning for the above is pretty simple. I am taking the same approach to QE2 news that I am take to earnings season. As the regular readers of this blog know, I don't like to hold a stock, no matter how confident I am about it, through its earnings as I believe that holding a stock through its earnings is akin to gambling. Same goes for QE2 announcement. What is the amount in play going to be? What is the number needed to make the market happy? How many billions of dollars worth of easing has the market only factored in? Even if the announcement seems very positive, is it going to be sell on news? Or is the market just going to rip higher? 

I have only one answer to all the above questions: I don't have a clue. Hence the need to shift in cash. The run from 1040 to 1180 has been great for me, and I am sure for most of you readers too and I believe its the time to cash out on those gains. Sure, the market might rip higher and I might miss out on some sweet gains, but the risk of holding through the announcement just doesn't appeal to me.

Take care and good luck!

Wednesday, October 27, 2010

Chart of the Day

Today's Chart of the Day is DMAN. Looks set to have a third shot at the 11 mark. Like the way MA(20) provided support during the pullback. Would like to see some volume come in before the end of the week.


Things get even more interesting when one has a look at the weekly chart. A break of 11.05 and this has room to run a lot higher.


Take care and good luck!

Important day tomorrow

In an earlier post today, I had written about the importance of MA(20) on the S&P and how it could be a potential game changer. Check it out if you haven't done so already! Well, the last two times the bears tried to take out this level during the course of this rally, the index rallied 23 and 13 points respectively the very next day.


And this is what makes tomorrow interesting in my opinion. Can the bears finally manage to drag the markets below this important level or will the bulls make a strong comeback like they have done in the past. As I have said before, I am betting on the bulls until the MA(20) actually does get taken down.

Take care and good luck!

The importance of MA(20)

A couple of days I commented that I would be staying bullish on the overall markets until MA(20) is breaking on the S&P. With the market approaching that level, I thought I would just do a quick post on the importance of this level. The best way to illustrate the importance of this level would be to just show the S&P chart from Feb to May. Here it is.
 

And this is where we stand right now. The last time we were were below this level was at 1080. As of today, MA(20) stands at 1168.


Take care and good luck!

Tuesday, October 26, 2010

Dollar at interesting levels

The dollar is rapidly approaching an important three year trendline as can be seen from the chart below.  Where the markets head from here depends on what kind of support this trendline provides. A break of this level and yearly highs are not far off.


Take care and good luck!

Monday, October 25, 2010

Resistance ahead. Trade Safely.

No, I am not turning bearish. Just that there are quite some important resistance levels ahead and I think the correct play now is to protect your profits and keep some cash handy. For quite some time, I have been talking about the weekly MA(200) level on the S&P. As marked in the chart below, this is exactly where the April rally ended and the market got rejected right at this level today. And in case this level is taken over by the bulls, 1200 lies right ahead and it also wont be an easy nut to crack. 


I am beginning to like the odds of a pullback here but am in no way turning bearish. Not till the MA(20) gets broken on S&P. The last time the market was below MA(20) on the S&P was at 1180 level and we have come a long way since. It has held as support on many occasions since then and is an important support for the bulls. 


To sum it up,it might not be a bad idea to have a decent cash position here. I would rather use the cash position as a hedge than short positions.

Take care and good luck!

Watch out for MA(200)!

The S&P is at weekly MA(200) - right where the rally got rejected last time. Interesting indeed!

Sunday, October 24, 2010

Consolidation plays

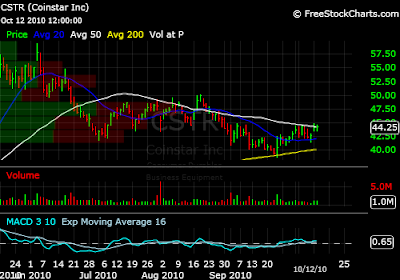
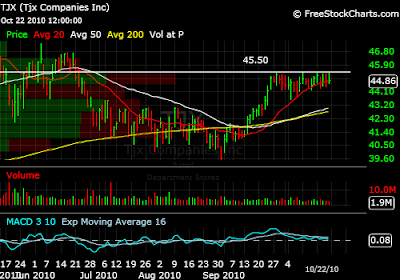
Here is a watchlist of some stocks that have been consolidating nicely for the past few days. The way I like to play these kind of setups is by buying them on break of important resistance levels, preferably on volume. Another way you could possibly play them is by getting in on test of support i.e. on bottom end of the range. Below the consolidation range would be one option to place your stops. Sure, you can take a partial position now too and then add on the break of resistance. No matter which way you decide to play them, be sure to check out the earnings date for when these stocks are reporting. I have mentioned the important resistance levels along with the stocks.

MENT - Break of 11.

CAB - Break of symmetrical triangle


ORLY - Break of 54.50


SPN - Break of 27.50


TJX - Break of 45.50


And if you are looking for more explosive setups, here are some heavily shorted stocks that I like for next week.

Take care and good luck!

Saturday, October 23, 2010

An explosive watchlist

Here are a few setups that I like. All these are heavily shorted stocks ( >20% float short), so I am looking for a short squeeze if these stocks catch some momentum. And as always, it being the earnings season, be sure to check when these stocks are reporting before getting into them. My own preference is not to hold any stock through its earnings date. I have commented on the charts itself.


Take care and good luck!

Wednesday, October 20, 2010

Bulls fight back

Today has got to be a very frustrating day for the bears. They ended yesterday well in control and with a golden opportunity to strike a blow for the first time in a long time. But it was the bulls all the way, with a performance which was even more dominating that that of the bears yesterday. With most of the major earnings out of the way, one would have to say now that odds are in favor of the markets making new highs for the year in the next two and a half months. But keep in mind that just as today was an important day for the bears to follow up on their performance from yesterday, tomorrow becomes an important day for the bulls as they try and come up with a follow through day. The next major resistance level I see on the S&P is the weekly MA(200). This is the level where the April rally was thwarted, so keep an eye on it this time too! Right now, it is at 1195.


On a personal note, I am in the process of changing jobs, so wont be able to devote much time to trading and hence the blog for the next few days. I will try to regularly post watchlists and important levels to watch out for etc but I doubt if I will have time for the daily reviews. But hopefully, things will be back to normal before too long!

Take care and good luck! And thanks for reading.

S&P important levels

What a day! It was bears all the way. For a while, it seemed like the financials (read GS) would make it another frustrating day for the bears, but the BAC news was the final nail on the coffin....at least for the day. However, one swallow does not make a summer and that's what makes tomorrow such an important day. That said, a lot of momentum stocks got badly hit today, take the solar stocks for example. Even if the markets do attempt to rally, I would avoid these stocks for a while unless you are a day trader. Let's have a look at the important levels on S&P.

Early in the trading day, I had put up a chart emphasizing the importance of the 1167 level. The BAC news finally caused this support for the index to break down, thus making it the new resistance. The feeble rally by the bulls late in the day was thwarted at this very level. So, this would be the first level to keep an eye on tomorrow.


I also expect there to be support at MA(20) - 1156. I don't think the bears will find the MA(20) level easy to break. And of course, then comes the grand daddy of all supports - 1150.


To wrap things up, there is a lot of underlying support for the bulls. However, I think it is best to enjoy this battle from the sidelines. The pullback here might last longer than the previous ones in this rally.

Take care and good luck!

Tuesday, October 19, 2010

1167 is the key

Keep an eye on 1167 on S&P. It is previous support and has held so far.


Take care and good luck!

GS - 158 is the key

As can be seen from the chart below, 158 remains a key level for the stock and a break of this level, could lead to a big move to the upside.


Here are the links to Bank of America and Apple support and resistance levels.

Take care and good luck!

BAC - Support and resistance

Due to rapid fall in BAC last week, it does not face much overhead resistance at 12 levels. It gapped down from 13.25 to 13.03 last week, so gap resistance should be expected at 13.03. Otherwise too, there is strong resistance at 13.02 to 13.05 levels. If there is no clear resistance in the vicinity, the same goes for resistance too. A break of Friday's low and it could be a steep ride down.

Take care and good luck!

P.S.: Here is the link to Apple support and resistance levels.

Monday, October 18, 2010

Apple support levels

Weak support at 294. Major support at 266 while 279 should also act as support in between.


Take care and good luck!

P.S.: Here is the link to Bank of America support and resistance levels.

Sunday, October 17, 2010

Watchlist

Here are some setups I like heading into next week. I still don't think it is prudent to short here, so they are all long plays. Sure, there will come a time to short these markets, and when it comes may very well be decided by the battle between financials and overall markets that's been going on the last two trading days, but I don't feel we are there just yet. It being earnings season, be sure to check when these stocks are reporting if you decide to play them. I have commented on the charts itself.


And here is the link to Chart of the Day.

Take care and good luck!

P.S.: Thanks to @szaman and @TheArmoTrader on twitter, here is an update on when few of these stocks are reporting. ALTR reports on Tuesday and APH on Wednesday.

Chart of the Day

Today's Chart of the the Day is DMAN. It closed above an important level - 10.85 - on Friday. As can be seen from the chart, during the last three months, this stock has a history of making a big move up after a period of consolidation and it seems like that time has arrived again. The MACD also made a bullish crossover on Friday.


Now, on to the weekly chart. 11.05 is an important level on the weekly, back from 2008, and the stock could really run on a break of this level.


Here's another stock that I like heading into tomorrow.

Take care and good luck!
A speculative play

I decided to do a separate post on this setup as I wanted to stress the fact that it is highly speculative and has the potential to run big, either way. So, please honor your stops in case you decide to play this one. After running up from around 3.5 to 6 in just a couple of days with huge volume, the stock has pulled back on lower volume for three consecutive days now. I like it here with a stop at or just below 4.50. Again, this is highly volatile but I like the risk/reward ratio here.


I will be back here looking at important levels and possible scenarios for next week and also with the Chart of the Day.

Take care and good luck!

Thursday, October 14, 2010

Funny day

BAC down 5.19%, JPM down 2.81%, GS down 2% and yet the markets hung in there admirably and with the help of a rally close to the end of the trading day, almost managed to close in positive territory. What could this mean?

(1) There is amazing underlying strength in these markets that can even withstand selling in heavy weight names like above. Do not mess with the bulls.

(2) This is just the calm before the storm and the action in financials today is a signal of things to come. See what happened to JPM and INTC after beating the street.

Both of the above are valid scenarios. Take your pick. My opinion? I am leaning towards the former. The bulls have been very impressive so far and in my view, they deserve the benefit of doubt. How long am I willing to give them this benefit of doubt? As I have stated many times  before, until the bears manage to close the markets below 1150.

Take care and good luck!

S&P Support and resistance

From the 5 minute chart:

Immediate support - 1168
Immediate resistance - 1173.89


Take care and good luck!

Update: The market got rejected right at the resistance shown in the chart above. Now, let's see if the support comes into play. Here is the updated chart.


Updated: The chart says it all!

Chart of the Day

I have commented on the chart itself.


Take care and good luck!

Wednesday, October 13, 2010

Watchlist

These are some stocks I like heading into tomorrow. All of these are heavily shorted and could run from here if the market reacts positively to JPM earnings which are coming out in pre market tomorrow.


And here is the link to Chart of the Day.

Take care and good luck!

Tuesday, October 12, 2010

Chart of the Day

Today's Chart of the Day is DFS, which was mentioned here a few days earlier too. It has been consolidating nicely since then and there was a nice increase in volume today. Watch out for a break of 17.10!


And here is the weekly chart. A cup and two handles pattern!


Take care and good luck!

Update: Here is the watchlist for tomorrow.